What the statistics on a match page tell you
Head to head, recent form, goals distribution, season comparison, standings and line-ups: what every statistic on a Match Terminal match page is built from, and where each one misleads.
Match Terminal8 min read
Every match page on Match Terminal carries the same block of statistics underneath the odds, and most of it is there because it answers a question a bettor actually asks before committing to a price. This guide goes through each section in order, says what the numbers are built from, and — more usefully — points out where each one tends to mislead.
You don't need an account to read any of it. Sign-in is only required to save a prediction.
Prediction snapshot
At the top sits a model's read on the fixture: home, draw and away percentages as three bars, usually with a short written summary, sometimes with BTTS and over 2.5 percentages and a scoreline guess alongside.
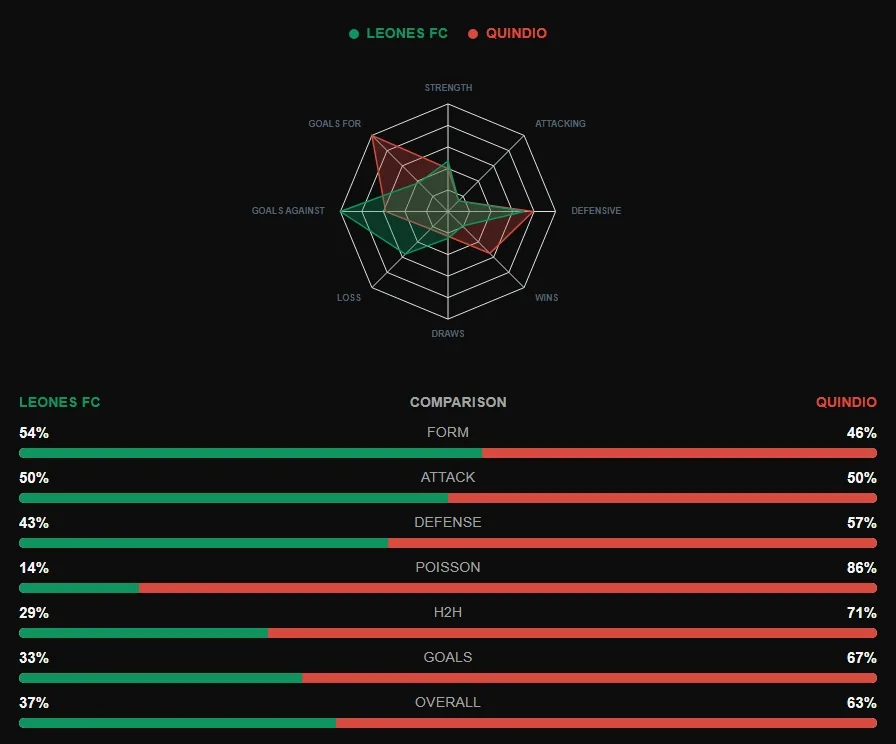
The radar plots both sides on eight axes — strength, attacking, defensive, wins, draws, loss, goals against and goals for — with each team's shape overlaid in its own colour. Its job is shape recognition, not precision: you're looking for where the two outlines pull apart, not reading values off it.
Below that, a Comparison block splits several factors between the two teams as percentage pairs — form, attack, defence, Poisson, H2H, goals, and an overall figure. These are the model's own weightings, not raw data, and the individual rows are more interesting than the overall. A side that's 50/50 on attack but 14/86 on Poisson is being marked down by expected-goals maths rather than by anything you'd see in a league table.
Treat this section as a starting opinion rather than an answer. It's most useful as a contrast: when the model's numbers and the bookmakers' prices disagree sharply, that gap is worth understanding before you back either side. The timestamp underneath tells you when it was generated, which matters, because a snapshot produced before a squad announcement doesn't know about it.
Head to head
The last six meetings between the two clubs, listed with dates and scores, each row keeping the orientation it was actually played in so you can see who was at home.
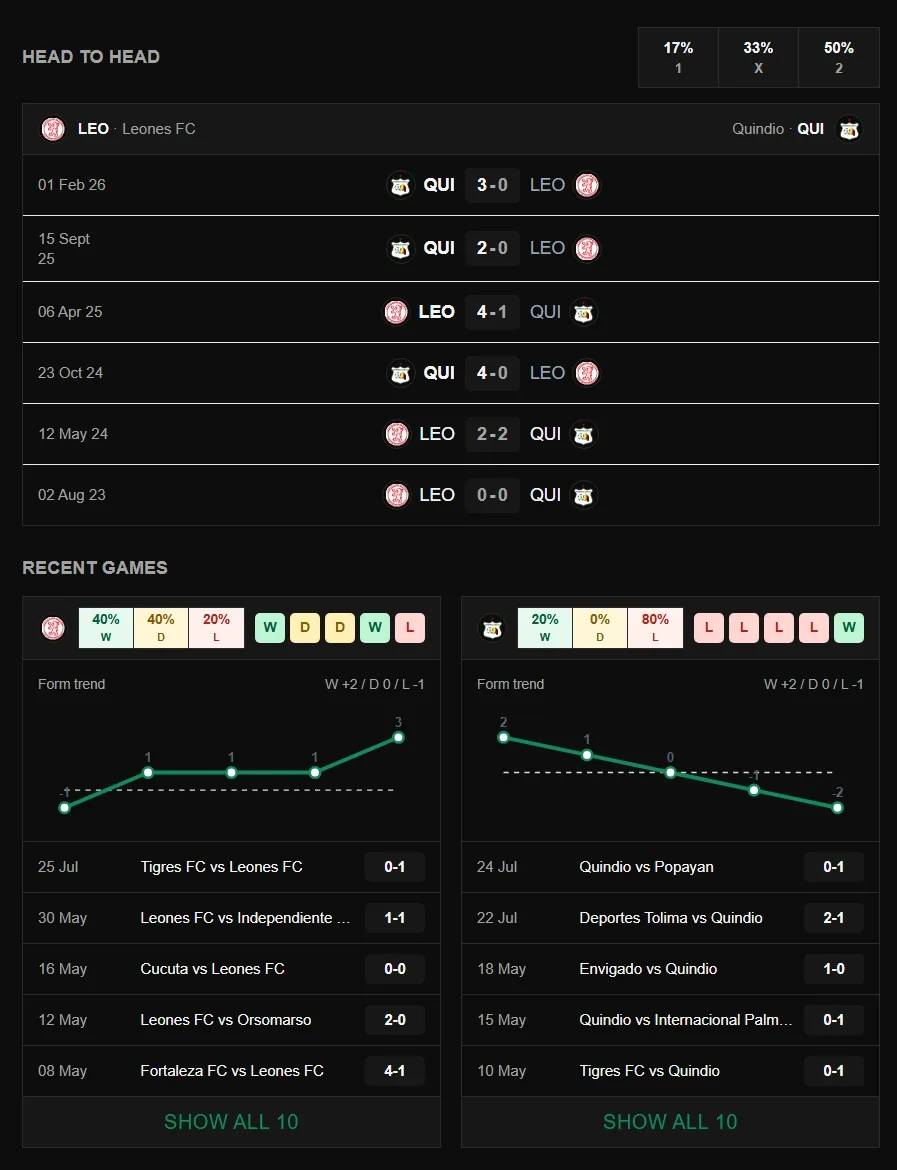
The three figures above the list are the record expressed as percentages — 1 / X / 2 — and they're oriented to this fixture, not to who hosted back then. A 50% in the "2" column means today's away side won half of those meetings, wherever they were played.
H2H is the statistic people over-trust most. Six matches is a small sample spread over several years, and the sides that played them may share little with the sides playing on the day — different managers, different squads, sometimes a different division. It's genuinely informative when a fixture has a persistent character (a derby that's always tight, a ground where the away side never scores) and close to noise otherwise.
Where it earns its place is in goals. A run of meetings that consistently finish under 2.5 often reflects something durable about how the two sides match up tactically, and that survives squad turnover better than a win-loss record does.
Recent games
Each team's last ten matches, across all competitions: date, fixture, score, and a W/D/L pill for each result. The card shows five by default and expands to the full ten.
Above the list are a win/draw/loss percentage split and a form trend line. The trend scores each result — a win is +2, a draw 0, a loss −1 — and plots the running total oldest to newest, so the slope tells you the direction of travel rather than the raw record. Two sides can both be on four points from five and look nothing alike: one climbing, one falling off a cliff.
Worth knowing: both the percentages and the trend line are calculated over whatever is currently shown. Hit Show all 10 and they recalculate across ten games. The five-game version is the noisier one.
Read the fixtures, not just the letters. Four wins looks identical in a form string whether it came against the top four or the bottom four, and the scoreline column is right there to give you the context. Note the competition too — a rested-side cup win tells you less about Saturday than a league defeat does.
Goals distribution
This is the most under-used section on the page, and the one that pays off most for goals markets.
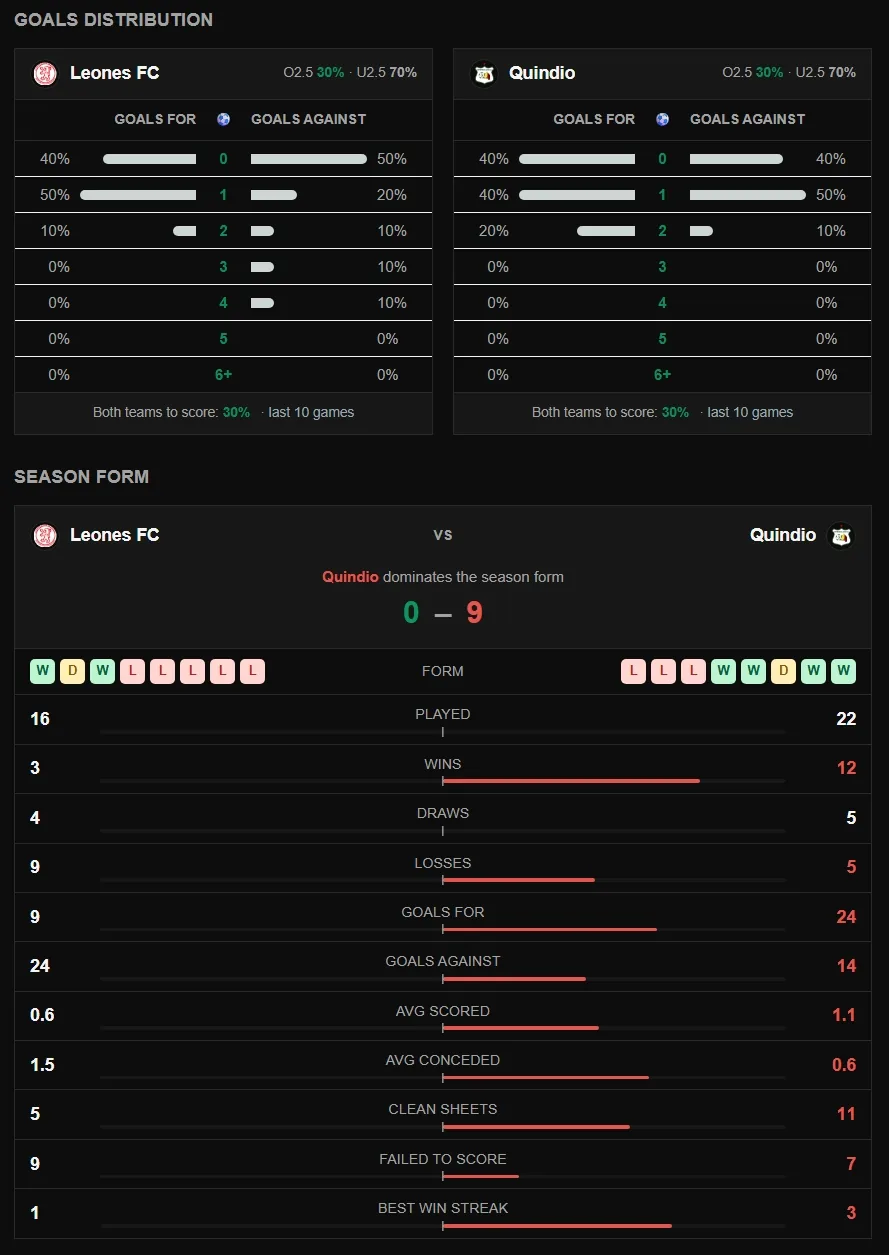
For each team, it takes those same last ten games and breaks them into buckets: the share of matches in which they scored exactly 0, 1, 2, 3, 4, 5 or 6+ goals, and the same again for goals conceded. The header carries the team's over/under 2.5 split, and the footer their both-teams-to-score rate.
The value here is in seeing a shape rather than an average. Two teams can both average 1.4 goals a game and be nothing alike: one scores exactly one goal almost every week, the other alternates blanks with threes. Their averages say the same thing; their distributions say completely different things about whether to back over 1.5. Read the columns for clustering, not just the mean.
In the example above, both teams have scored 0 or 1 in 90% of their recent games — an over 2.5 backer should want no part of that fixture, whatever the price says.
One caveat worth holding onto: the over 2.5 and BTTS percentages here describe the whole match, both teams combined, in games that team played. That's the right frame for a goals bet, but it means a solid team repeatedly playing open opponents will show a high over rate that has as much to do with the opposition as with them.
Season form
A side-by-side comparison of the two teams within the league they're both playing in, across eleven metrics: played, wins, draws, losses, goals for, goals against, average scored, average conceded, clean sheets, failed to score, and best win streak. Each row draws a bar towards whichever side is ahead, with the better number tinted.
The headline score above it — "0 – 9" in the screenshot — is simply a count of how many of those eleven metrics each team wins, and the sentence above translates the margin: a side edges, leads on, or dominates the season form. It's a quick summary, not a weighting. Winning eleven-nil on metrics does not make a team eleven times better, and the market will already have priced most of that gap.
The rows to read closely are average conceded and failed to score. Those two do more work in goals and BTTS markets than the win-loss record does, and they're less baked into the 1X2 price.
Note that this section is league-only. A team's cup form isn't in these numbers, whereas it is in the Recent games card above.
League standings
The full table for the competition, with both fixture teams highlighted so you can see the gap without scanning.
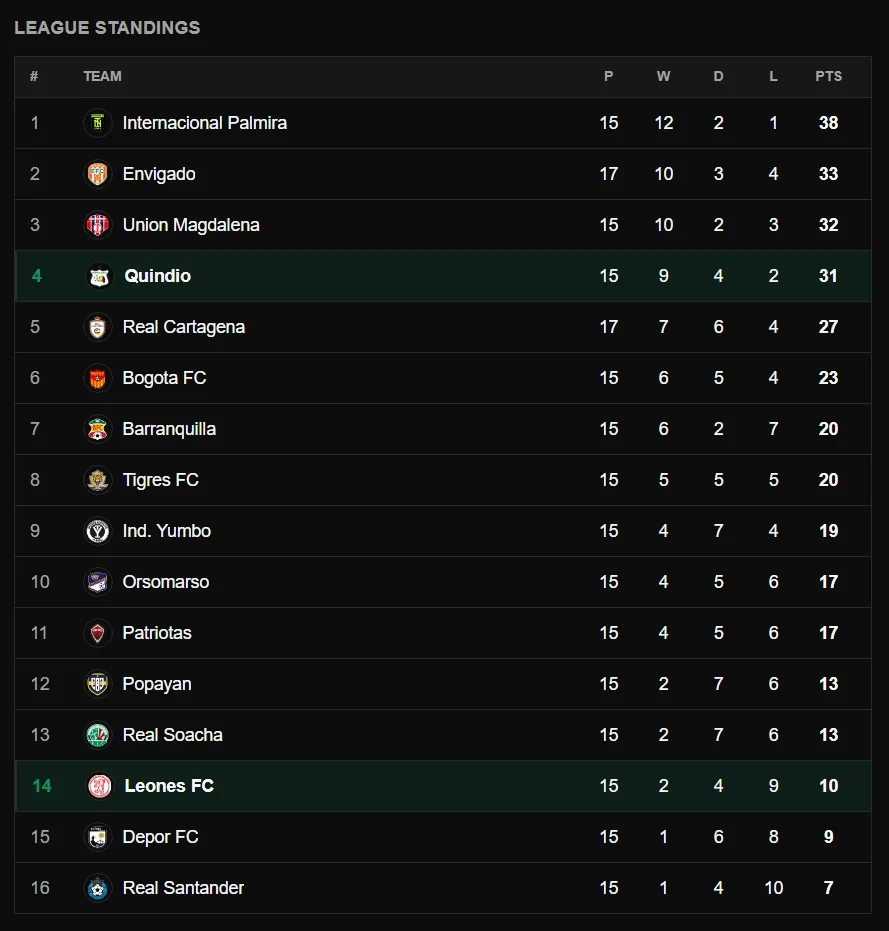
Check the played column before you read anything else into positions. Tables with games in hand are routinely misread — a side three points back with two games spare is ahead, not behind, and early-season tables are especially uneven.
The other thing the table gives you is context the odds don't always reflect: whether a match matters. A mid-table side with nothing left to play for in April is a different proposition from the same side in November, and that shows up in the standings long before it shows up in a price.
Every team name in the table is a link to that club's own stats page, which is the fastest way to check a side you don't know well.
Line-ups and player ratings
Confirmed line-ups appear once the clubs release them — typically around an hour before kickoff — with the starting eleven, substitutes, formation and coach for each side.
This is the single most valuable piece of information on the page, and it arrives last. A forward on the bench changes a goals market more than anything in the sections above. It also arrives inside the window where prices move fastest, so if you're waiting for team news you're competing against everyone else who is.
After kickoff the same area fills with player ratings — minutes, goals, assists, shots and a rating for every player involved. That's a post-match read rather than a betting input, but it's the honest record of who actually played well, which is often not who scored.
Reading it all together
The sections are ordered roughly from broadest to most specific, and that's a reasonable order to read them in, but it isn't the order they should carry weight in.
Corroboration beats any single number. One statistic pointing at under 2.5 is a coincidence. The goals distribution, the average conceded row and the H2H scorelines all pointing there is a case.
Ask what the market already knows. Nearly everything on the page is public and priced in. League position, season form and recent results are in the odds before you open the page. The edge, when there is one, tends to sit in the details that resist a simple average — distributions, timing, team news — not in noticing that the better team is better.
Small samples say small things. Ten games and six head-to-heads are what's available, not what's statistically comfortable. A 30% figure drawn from ten matches is three matches. Hold every percentage on the page a little more loosely than its precision suggests.
Open today's fixtures and pick any match to see all of this on a real game — or read how to turn that read into a recorded prediction.
Statistics and predictions on this site are informational only. Gamble responsibly, never stake what you can't afford to lose, and if betting stops being fun, BeGambleAware has free, confidential help. 18+